The Best Indicator for Forex Trading Success
The Best Indicator depends on what a trader or analyst is attempting to achieve. Indicators are comparable to a workman’s tool kit: every tool has a different function and it is important to choose the correct tool for the job in hand.
Below we will discuss a few of the more useful indicators and how they can be used.
Best Indicator for Forex Trading
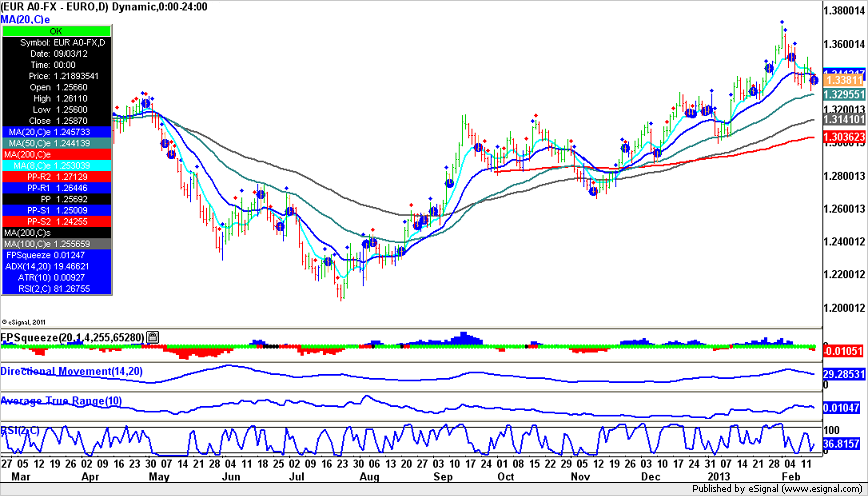
Average True Range (ATR):
Developed by Welles Wilder, ATR is an indicator that measures volatility. ATR can be used for calculating where to place stops, profit targets and position sizing.
Wilder started with True Range (TR), which is defined as the greatest of the following:
-
Current High less the current Low
-
Current High less the previous Close (absolute value)
-
Current Low less the previous Close (absolute value)
Typically, the Average True Range (ATR) is based on 14 periods and can be calculated on an intraday, daily, weekly or monthly basis as follows:
Current ATR = [(Prior ATR x 13) + Current TR] / 14

  - Multiply the previous 14-day ATR by 13.
  - Add the most recent day's TR value.
  - Divide the total by 14
Moving Averages
Moving averages smooth the price data to form a trend following indicator. A simple moving average is formed by computing the average price of a security over a specific number of periods. Most moving averages are based on closing prices. Moving averages are generally used to measure momentum and define areas of possible support and resistance.
A simple 5 day moving average is calculated as follows
Daily Closing Prices: 12,13,14,15,16,17,18

First day of 5-day SMA: (12 + 13 + 14 + 15 + 16) / 5 = 14

Second day of 5-day SMA: (13 + 14 + 15 + 16 + 17) / 5 = 15

Third day of 5-day SMA: (14 + 15 + 16 + 17 + 18) / 5 = 16
RSI
RSI is a momentum indicator which compares the magnitude of recent gains to recent losses in an attempt to determine overbought and oversold conditions. It is calculated using the following formula:
RSI = 100 – 100/(1 + RS*)
*Where RS = Average of x days’ up closes / Average of x days’ down closes.
RSI oscillates between zero and 100. The indicator is overbought when above 70 and oversold when below 30. Signals can also be generated by looking for divergences.
MACD
MACD (Moving Average Convergence/Divergence) is used to spot changes in the strength, direction, momentum and duration of a trend.
MACD is calculated as follows:
MACD: (12-day EMA - 26-day EMA)

Signal Line: 9-day EMA of MACD

MACD Histogram: MACD - Signal Line
In summary the Best Indicator with depend on your trading objectives. Once you have chosen the Best Indicator for Forex Trading as dictated by your trading objectives, you can view this indicator in your Forex Platform.